Growing Mermaid Editor From 3,000 to 30,000 Monthly Visitors
I built Mermaid Editor because I wanted to edit Mermaid diagrams without committing a change just to see how they rendered. In the original case study, I wrote about the editor architecture, exports, and the first month of usage. This is the follow-up: what I built around that core workflow, what the numbers show, and what I would do the same way again.
On a consistent measurement basis, Mermaid Editor went from 2,814 tracked visitors in March 2026 to 27,403 in May, then passed 30,000 in June with 37,458. By October, it recorded 72,501 monthly visitors and 20,874 export completions.
A diagram edit shouldn’t need a commit
I like that Mermaid diagrams are plain text. They can live next to code, go through review, and change without anyone maintaining a separate drawing file. But the edit, commit, render loop made even a small decision feel bigger than it needed to be: move a label, fix a syntax mistake, then wait to see the result.
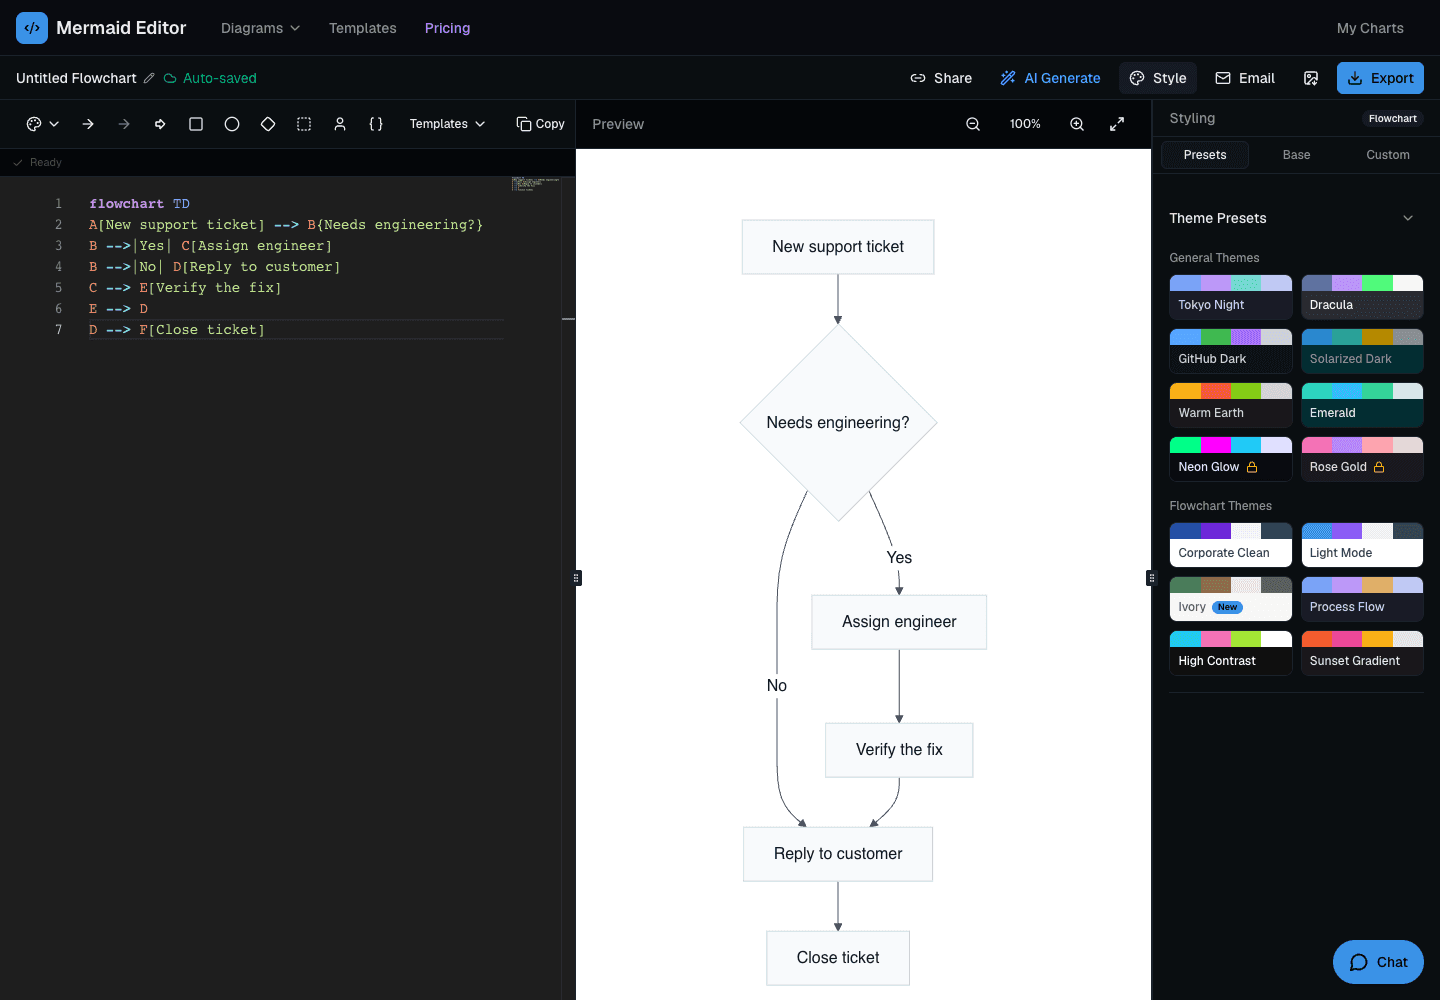
I built a place to work on the diagram itself. The Monaco editor and live preview sit next to each other, so I can try a different branch or theme and go right back to the source instead of redrawing anything.
Make the result useful outside the editor
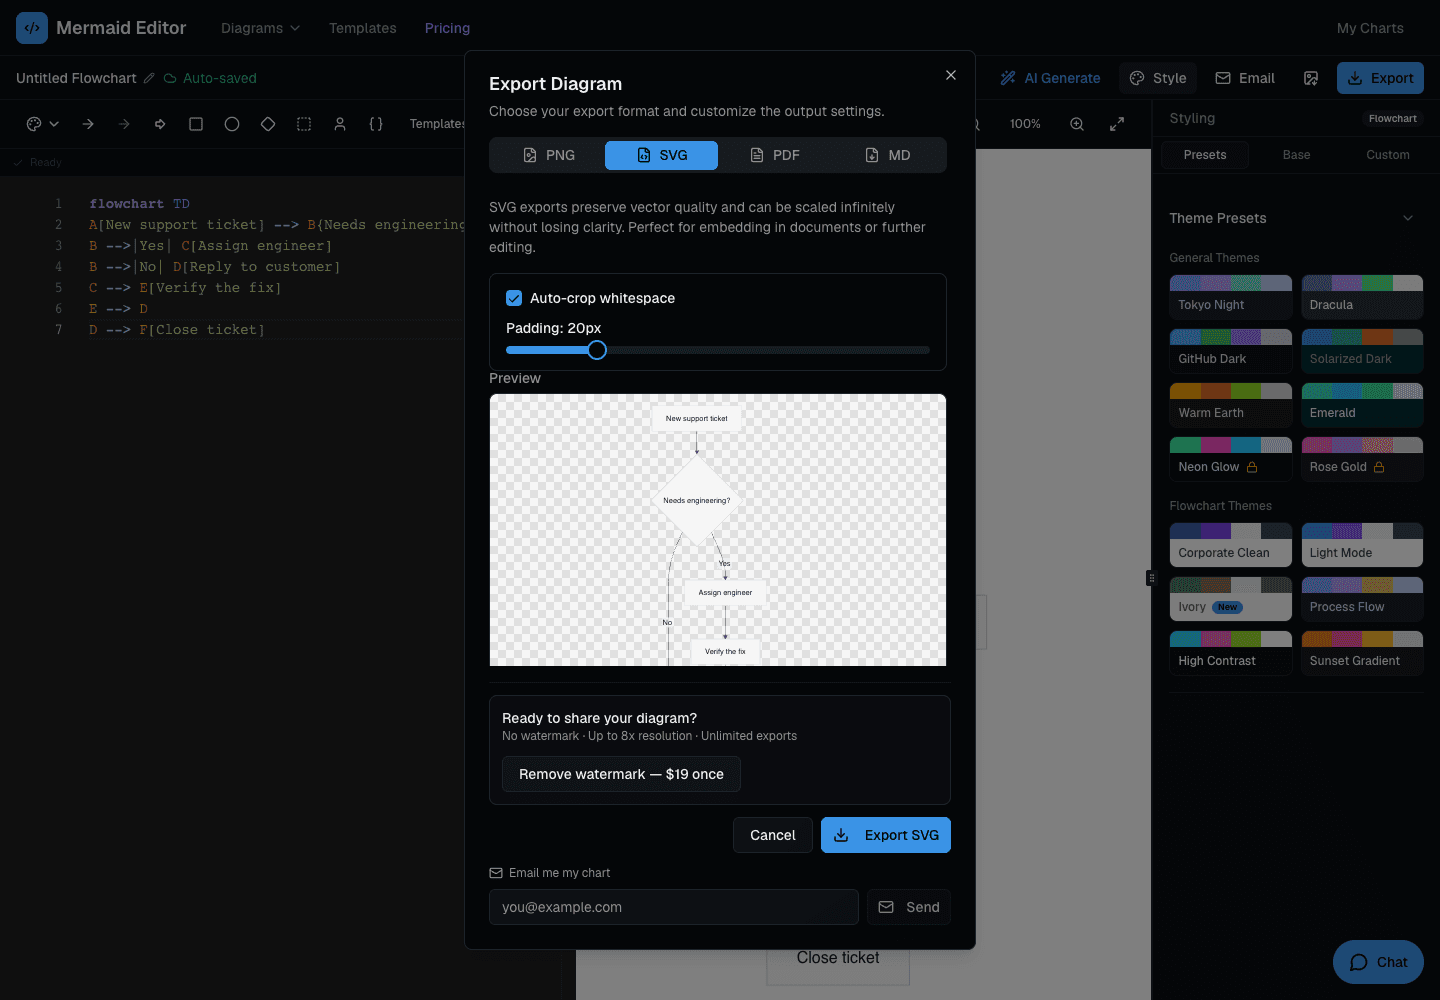
Seeing the diagram is only half the job. I wanted to keep the Mermaid source and take the right file into whatever I was doing next. The editor exports PNG, SVG, PDF, and Markdown. SVG is useful when I need the diagram to scale cleanly in a document. PNG is an easy choice when I just need to drop an image into a slide.
Build search landing pages that let people do the job
If someone searches for a Mermaid sequence diagram or Gantt chart, I’d rather give them a relevant example they can edit than send them to a blank editor. Dedicated pages give each task a starting point. As of November 21, the template library has 52 examples across six categories.
That’s how I think about search for a tool like this: match the task, then let the visitor do it. The traffic series shows growth. It doesn’t isolate how much of that growth came from any particular page, feature, or channel.
What the data actually shows
| Month (2026) | Tracked visitors |
|---|---|
| March | 2,814 |
| April | 6,395 |
| May | 27,403 |
| June | 37,458 |
| July | 63,790 |
| August | 74,889 |
| September | 78,621 |
| October | 72,501 |
Monthly visitor figures count unique PostHog IDs with a pageview on the production site. The original article used the March dashboard available at the time. I remeasured March with the same query as the other months for this comparison. September, not October, had the highest monthly visitor count in this series.
October’s 20,874 recorded export completions include 18,805 from the export dialog and 2,069 quick exports. They count events, not distinct charts or people. The same diagram can be exported twice.
Across the available tracking window, February 1 to November 20, 2026 (Arizona time), Mermaid Editor recorded 399,251 unique visitors, 1,075,450 pageviews, and 132,612 export completions. The visitor total is deduplicated over the full period in PostHog, not a sum of monthly figures or an audited count of individuals.
What I’d keep from this project
I’d start with the same constraint again: pick one annoying loop and make the first useful action immediate. The editor is the product, not a demo behind the landing page. The best template or search landing page gets someone straight to something they can edit and take with them.